FTIR analysis
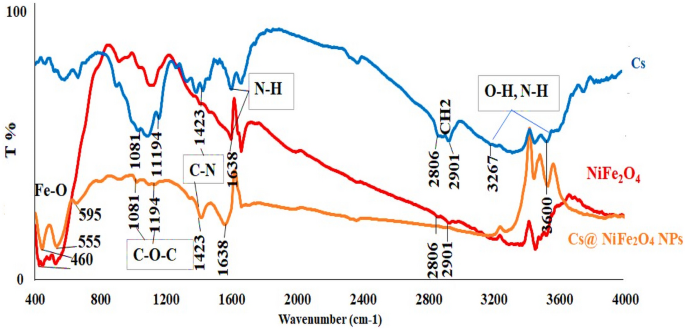
The FTIR spectra of Cs, NiFe2O4 NPs, and Cs@NiFe2O4 NPs are presented in Fig. 2. The FTIR spectrum of Cs indicates a broad band at 3600–3267 cm-1 attributed to O–H (hydroxyl group) and NH2 (amine group) starching vibrations48,49, sharp peaks owing to symmetric and asymmetric C–H stretching vibrations at 2901 cm−1 and 2806 cm−1, respectively, and peaks at 1638, 1423, and 1194 cm-1 due to N–H (amide I) bending, C–N carboxylic vibrations of the glycoside ring, C–O–C respectively50,51.
The FTIR spectra of Cs, NiFe2O4 NPs, Cs@NiFe2O4 NPs.
The FTIR…
Continue Reading
News Source: www.nature.com